A practical guide to tracking calls, inquiries, appointments, quotes, customers, revenue, and profitability without drowning in vanity metrics.
Marketing reports often create more confusion than clarity. A business owner may see website visits, impressions, clicks, likes, and email opens rising without knowing whether those activities produced paying customers.
The solution is not to track everything. It is to build a simple path from marketing activity to revenue, then review the numbers consistently.
Start with the business problem, not the dashboard
The most useful marketing metric depends on the decision you need to make.
If you are deciding whether to continue an advertising campaign, you need to know how many qualified opportunities and customers it produced. If leads are coming in but few become customers, you need to examine response time, qualification, follow-up, appointments, quotes, and sales conversion.
A practical tracking system should answer questions such as:
How many people contacted the business?
How many inquiries were genuinely qualified?
How many appointments or consultations were booked and kept?
How many quotes or proposals were sent?
How many became customers?
What did each source produce in revenue?
How much did it cost to acquire a customer?
Did the customer return or refer someone else?
Was the resulting work profitable?
Website traffic and social engagement may help explain what is happening, but they should not be treated as business outcomes by themselves.
Build one basic marketing-to-sales record
You can begin with a spreadsheet, a customer relationship management system, or a combination of existing tools. The important point is consistency: every inquiry should have a source, a stage, and an outcome whenever possible.
Create one row for each lead or customer and record:
Date of first inquiry
Customer or company name, or an internal ID
First marketing source
Campaign, if relevant
Type of inquiry
Current stage
Qualified or unqualified status
Appointment date and outcome
Quote or proposal value
Final revenue
New or returning customer
Referral information
Date and time of first response
Define each stage before you begin reporting. For example, “qualified inquiry” might mean the prospect is in your service area, needs a service you provide, and has a realistic timeline. The definition will vary by business, but it should remain stable from month to month.
The numbers that deserve regular attention
Calls and qualified inquiries
For many small businesses, a phone call is more valuable than a click. Track the number of calls, missed calls, answered calls, and calls that resulted in a meaningful business opportunity.
Also track form submissions, emails, direct messages, and walk-ins where relevant. Do not count every contact as a qualified lead. Separate general questions, spam, job applications, vendor inquiries, and out-of-area requests from genuine prospects.
Booked and kept appointments
A booked appointment is not the same as a completed appointment. Track both.
For service businesses, this may mean scheduled estimates or site visits. For professional practices, it may mean consultations or first visits. For online businesses, it could be a booked sales call or product demonstration.
A high booking rate with a low attendance rate suggests a different problem from a low booking rate. Keep those stages separate.
Quotes and proposals
Record how many quotes or proposals were sent, their total value, and how many eventually became sales.
A quote-to-sale conversion rate is:
Number of sales ÷ Number of quotes × 100
Review this by source when the data is available. A channel that produces fewer inquiries but more serious quote requests may deserve more attention than one producing a large number of low-intent contacts.
Conversion rates
Conversion rates are useful only when the stages are clearly defined. Common calculations include:
Inquiry-to-qualified rate: qualified inquiries ÷ total inquiries
Inquiry-to-appointment rate: booked appointments ÷ total inquiries
Appointment-to-quote rate: quotes ÷ completed appointments
Quote-to-sale rate: sales ÷ quotes
Lead-to-customer rate: new customers ÷ total leads
Do not combine unlike stages or compare numbers built from different definitions. A “lead” in an e-commerce store may mean a newsletter signup, while a “lead” for a plumber may be a phone call requesting an estimate.
Customer acquisition cost
Customer acquisition cost, or CAC, estimates how much sales and marketing spending was required to acquire each new customer.
CAC = Total sales and marketing costs ÷ Number of new customers
Decide what to include before comparing periods. A narrow calculation may include advertising spend only. A broader calculation might also include marketing software, agency or freelancer fees, sales commissions, and relevant staff time.
Neither approach is automatically correct. The key is to label the method and use it consistently. If a source produces revenue but requires substantial labor, a media-spend-only CAC may make that source look better than it really is.
Revenue by source
For each closed sale, record the original source when possible. Then total the revenue associated with each channel during the selected period.
Possible source categories include:
Organic search
Paid search
Social media
Email
Referral
Repeat customer
Walk-in
Marketplace or platform
Direct or unknown
Revenue by source is more useful than lead volume alone, but it is still not the same as profit. A source may produce high-value customers, low-margin work, delayed payments, or significant fulfillment costs.
Repeat business and referrals
Track new customers separately from returning customers. A repeat customer may not represent a new acquisition, but repeat revenue is important when evaluating the overall value of the customer relationship.
Useful measures include:
Number of returning customers
Revenue from existing customers
Repeat purchase or repeat booking rate
Number of customers acquired through referrals
Revenue from referred customers
Record referrals using a simple “referred by” field. Do not rely only on memory or informal comments from staff.
Response time
Track the time between an inquiry and the first human response. A missed call returned later, an unanswered form, and a prompt reply are not equivalent experiences.
Review response time alongside conversion rates. If inquiries are steady but appointments decline, response time may be one factor worth investigating. Avoid assuming that it is the only cause without examining the actual records.
Metrics differ by business type

Plumbers, HVAC companies, and electricians: Focus on calls, service-area qualification, booked jobs, estimates, quote acceptance, average job value, repeat service, and referrals. Track whether the job was profitable after materials, labor, travel, subcontractors, and other direct costs.
Realtors: The sales cycle may be much longer than a month. Track inquiries, conversations, consultations, signed clients, listings, offers, and closings. Revenue may arrive well after the original marketing interaction, so monthly lead metrics should not be judged as if every inquiry can close immediately.
Restaurants: Track reservations, orders, covers, first-time customers, repeat visits, direct orders, and revenue from promotions or channels. Delivery platforms may provide useful order data, but platform fees and menu-level margins should be considered separately.
Professional practices: Track inquiries, scheduled consultations, kept appointments, new clients or patients, referrals, and repeat visits. Use the minimum personal information necessary and take extra care with confidential or regulated information.
E-commerce businesses: Track sessions, product views, add-to-cart activity, checkouts, orders, revenue, refunds, repeat purchases, and CAC. Gross margin should account for product costs and, where relevant, returns, shipping, packaging, and platform costs.
Online businesses: Track inquiries, booked calls, demonstrations, proposals, purchases, subscriptions, renewals, cancellations, refunds, and fulfillment costs. A high conversion rate is not enough if delivery costs or customer support requirements leave little margin.
A simple monthly scorecard
Use one page or spreadsheet tab. The following structure is enough for a first version:
| Metric | This month | Three-month view | Notes |
|---|---|---|---|
| Total inquiries | Include calls, forms, email, and other defined sources | ||
| Qualified inquiries | Apply the same qualification rules | ||
| Booked appointments | |||
| Kept appointments | |||
| Quotes or proposals | |||
| New customers | |||
| Lead-to-customer rate | New customers ÷ inquiries | ||
| Marketing and sales costs | State what is included | ||
| CAC | Costs ÷ new customers | ||
| Revenue by source | Use a separate source table if needed | ||
| Returning customers | |||
| Referred customers | |||
| Median or average response time | Keep the calculation consistent | ||
| Gross margin context | Use accounting records where possible |
Review the scorecard monthly, but avoid making major decisions based on a very small number of leads or sales. A three-month rolling view can provide useful context, although it does not remove seasonal effects or data-quality problems.
Attribution, privacy, and incomplete data
Attribution is imperfect. A customer may see an ad, search for the company later, ask a friend, and then call from a bookmarked number. A single “source” field cannot capture every influence.
For a small business, start with two fields:
First source: how the customer initially discovered the business
Last known source: the interaction most closely associated with the inquiry or sale
Use these fields as directional evidence, not absolute proof. If the source is unknown, record “unknown” rather than guessing.
Collect only the information needed to operate and measure the business. Explain data collection on forms, obtain consent where required for marketing or tracking, restrict access to customer records, and avoid storing sensitive details that are not necessary.
Also verify how your local privacy and consumer-protection rules apply. Legal requirements differ by location, industry, and data type.
Gross margin puts marketing performance in context
Revenue is an important outcome, but it does not show what remains after direct costs.
A basic gross margin calculation is:
Gross margin = (Revenue − Cost of goods sold) ÷ Revenue × 100
The appropriate definition of cost of goods sold can vary. For a product business, it may include inventory costs. For a service business, the accounting treatment of direct labor and materials should be confirmed with a qualified accounting professional.
Compare sources using both revenue and margin where the data is reliable. A channel that produces less revenue may still be more valuable if it consistently produces work with stronger margins and manageable delivery costs.
Tools to evaluate, without assuming they are right for you
A spreadsheet may be sufficient at the beginning. As volume increases, a business might evaluate a CRM, web analytics platform, call-tracking system, booking tool, or accounting integration.
Before choosing any system, verify current pricing, features, data-retention policies, integrations, reporting limits, and suitability for your industry.
The tool matters less than the operating discipline. A simple system with complete records is more useful than an advanced dashboard filled with missing or inconsistent data.
The practical takeaway
Track the path from inquiry to profitable customer:
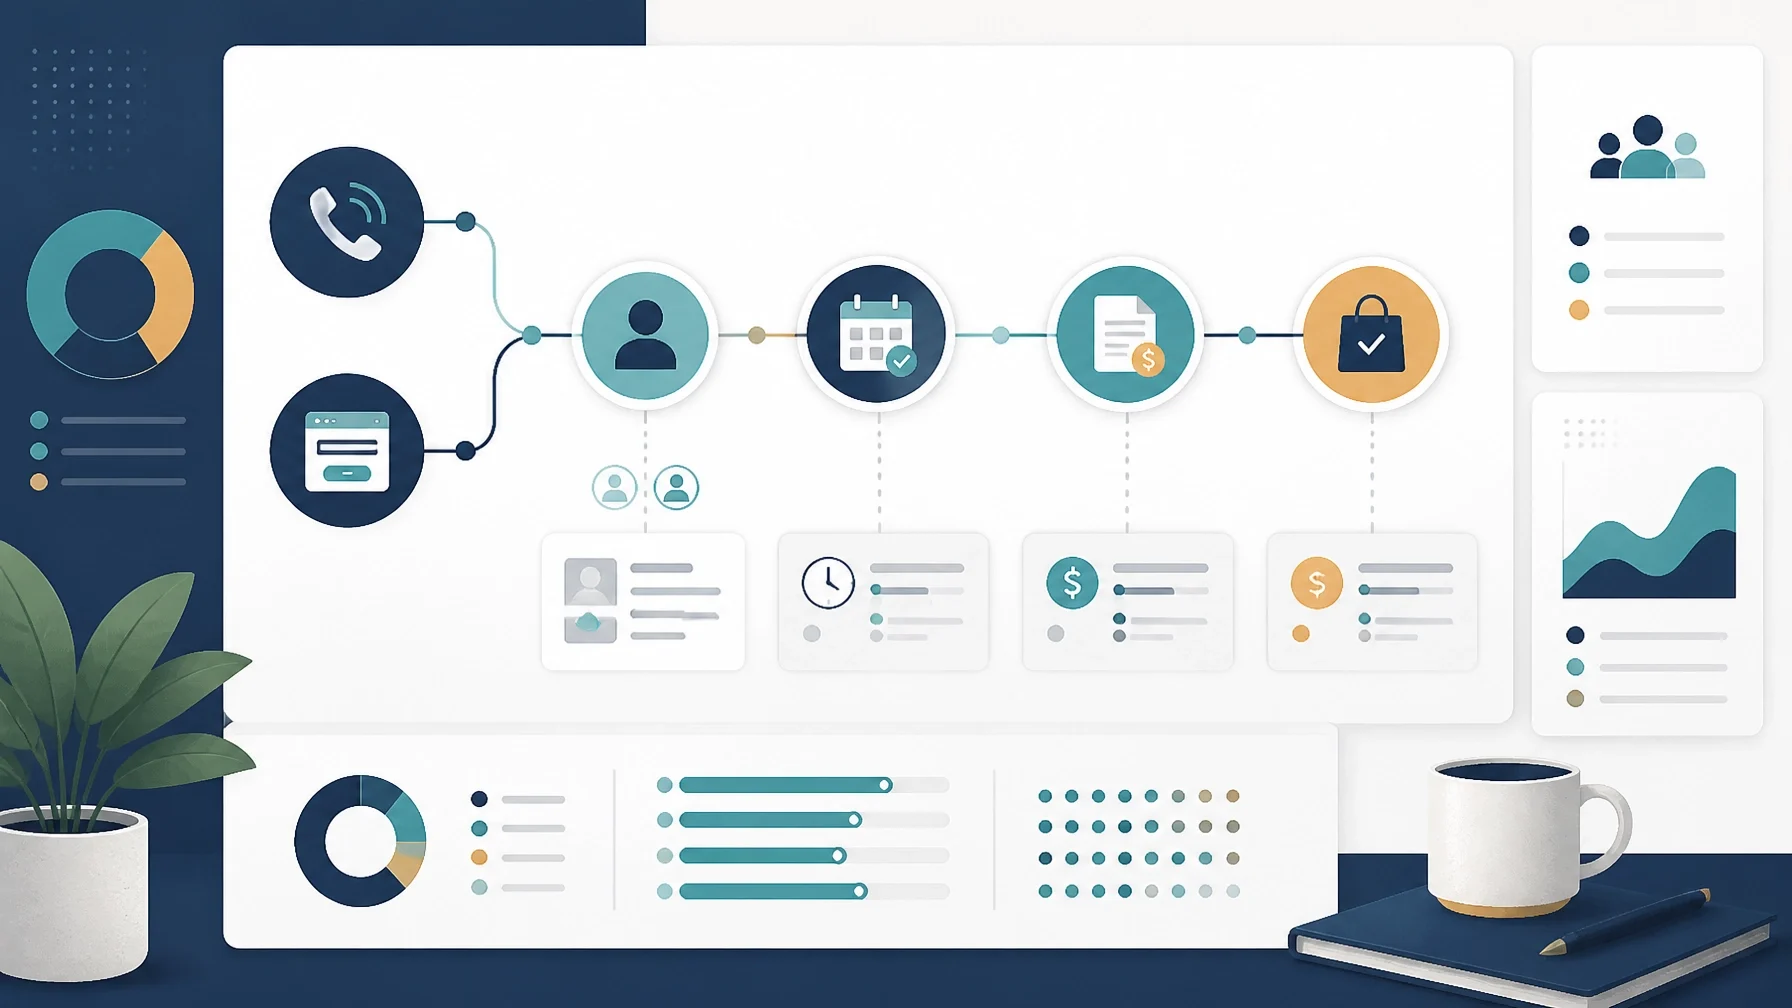
Source → inquiry → qualification → appointment → quote → sale → revenue → repeat business or referral
Choose a small set of definitions, record them consistently, and review both short-term results and longer-term patterns. Marketing measurement is not about producing the most impressive dashboard. It is about making better decisions with the information your business can actually verify.
The goal is not perfect reporting. It is a practical measurement system that helps you see which activities create qualified opportunities, customers, revenue, and healthy margins over time.